Mini Tutorial: Signal to noise ratio
Objectives:
Develop an intuitive understanding of how the signal-to-noise ratio make impact activation reliability
Learn about spatial and temporal signal-to-noise ratio measures
Lecture notes
Lecture 03a: fMRI statistics: Correlation
Lecture 03b: fMRI statistics: Using the General Linear Model (GLM) to do a correlation
Lecture 03c: fMRI statistics: Extending the GLM to more conditions and multiple runs
Lecture 04d: Preprocessing
Data
Overview
This tutorial complements Tutorial 2, 3 and 4: the aim of the current mini-tutorial is to help you better understand the relationship between signal and noise in fMRI data. Other tutorials (like Tutorial 5 and 6) will show you how we can increase the signal to noise ratio.
In tutorial 2 and 3, we explained that the activation we record is composed of two parts: signal and noise. The signal is the variation in the BOLD activation we CAN explain. For example, if the activation in a given voxel increases at the start of an experimental condition (e.g., presenting faces) and decreases at the end of the experimental condition (e.g., fixation), then we can say that the variation in the activation (the increase and decrease of BOLD activation) is explained (at least in part) by the experimental protocol. The noise is the variation in th BOLD activation that we CANNOT explain (or put simply, it is left over variance once we have subtracted out the variance we can explain).
Importantly, the degree to which we can make inferences depends on the ratio of signal to noise in our data. In the first part of the tutorial, you will develop intuitive understanding about how different levels of signal and noise are related to the reliability of activation for a single voxel. In the second part, we will introduce various measures of signal-to-noise ratio used in fMRI analyses.
Understanding Signal-to-Noise Ratio
As mentioned above, BOLD activation (or any other type of data) is composed of signal and noise. Let’s pretend we are an all powerful, omnipotent, omniscient being, and that we knew the exact amount of signal and noise contained in a time course. The two sliders on the left (“signal” and “noise”) allow you to manipulate the BOLD activation you could in theory record. The two sliders on the right (“slope” and “constant”) allow you the fit the predictor (pink) to the BOLD activation.

Widget SN-1 : Manipulate the signal and noise sliders to see the impact on the reliability/strength of the activation to a given stimulus
Move the "signal" slider up and down in the BOLD controls section.
Question 1: a) What effect does moving the "signal" slider on the BOLD activation(grey)?
b) What effect does moving the "signal" slider on the scatter plot?
Now, move the "noise" slider up and down.
Question 2: a) What effect does moving the "noise" slider on the BOLD activation(grey)?
b) What effect does moving the "noise" slider on the scatter plot?
Reset the widget by refreshing the webpage. Now fit the predictor (pink) to the BOLD activation using the B1 and Constant sliders(Predictor controls). You can use the Optimize GLM button if you wish to obtain the optimal solution.
Question 3: a) What is the correlation coefficient for this model? How much of the variance is explained in this model? (Hint: you can find the percent of explained variance by squaring the correlation coefficient.)
We will now examine four cases:
- high signal + low noise (signal = 0.80, noise = 0.20)
- high signal + high noise (signal = 0.80, noise = 0.80)
- low signal + low noise (signal = 0.20, noise = 0.20)
- low signal + high noise (signal = 0.20, noise = 0.80)
For each case, set the signal and noise values to the ones specified in the parentheses, fit the model using the Optimize GLM button, and record the correlation coefficient. (Tip: you can use the arrows on your keyboard to get exact slider values.)
Question 4:
a) Which case has the highest signal to noise ratio? Which case has the lowest signal to noise ratio? What correlation coefficient do each of these cases have?
Now set the signal value to 0.50 and the noise value to 0.50.
b) Fill in the blanks with either "increase" or "decrease": When you increase the signal value while keeping the noise term constant, the correlation coefficient ___. When you decrease the signal value, the correlation coeffcient ___. When you increase the noise value while keeping the noise term constant, the correlation coefficient ___. When you decrease the noise value, the correlation coeffcient ___.
c) Does changing the predictor sliders change the correlation coefficient? Why or why not?
d) When it comes to determining whether a voxel is reliabily activated to a given condition, does a higher signal necessarily mean better reliability?
Quantifying Signal-to-noise Ratio
In the previous section, we saw how noise can impact the reliability of BOLD activation to a given stimulus. Given the unavoidability of noise in our measures, we might want to assess the quality of our data by measuring how noisy it is.
Signal-to-noise Ratio (SNR)
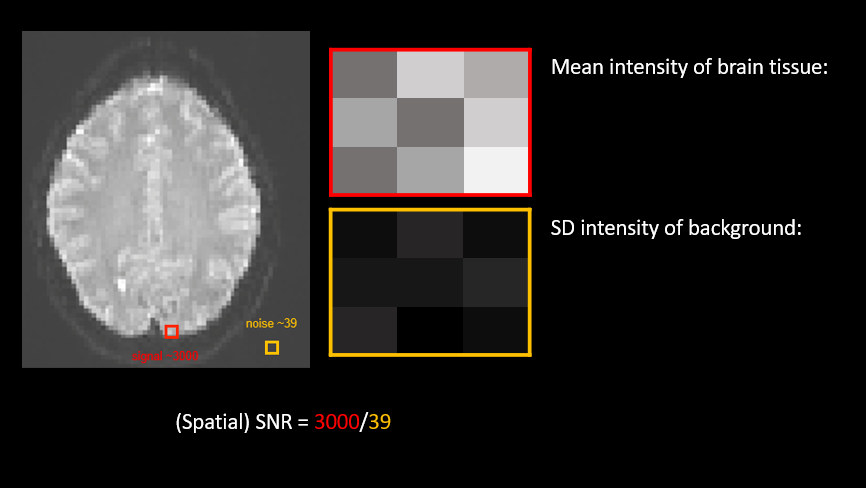
The signal-to-noise ratio compares the level of signal to the level of background noise. For example, we can obtain a spatial SNR for anatomical scans by comparing the intensity of the brain tissue to the background. We can do this using the following formula:
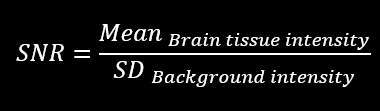
This spatial SNR will depend on the scanning parameters such as the strength of the magnetic field the type of head coil or the number of channels on the head coil. A low SNR may indicate scanner related problems.
Temporal Signal-to-Noise Ratio (tSNR)
The same principle can be applied to functional scans but instead of estimating spatial noise, we are estimating noise over time. For each voxel, we divide the mean signal intensity over time by the standard deviation of voxel time course. The standard deviation of the error is more precisely estimated once we remove the signal.

Download the Signal-to-noise spreadsheet. The spreadsheet includes information about 2 voxels (Voxel A and Voxel C) including the raw BOLD signal, the predictor(obtained by estimating the optimal slope and intercept, and then calculating the predicted scores for the timecourse) and the residuals (BOLD - signal).
Question 5: Using the information given in the spreadsheet, estimate the tSNR for both voxels.
Although SNR may be useful for assessing the quality of structural images, researchers using fMRI are often more interested signal fluctuations over time related to different experimental conditions. This is were contrast-to-noise ratios come in.
Contrast-to-Noise Ratio (CNR)
We can assess the quality of the data by comparing the contrast between two signals to the amount of noise in our measure. For example, differentiating grey from white matter in a noisy anatomical image would be hard because the contrast between the two types of tissue would be very low. However, grey and white matter would be easy to different an anatomical image with low noise because the contrast between the two tissues would be high. We can measure the contrast-to-noise ratio for spatial images using the following formula.

Visually, low and high spatial contrast would look like this:
(Image of grey vs white matter x2 - one with high contrast, another with low contrast)
Temporal Contrast-to-Noise Ratio (tCNR)
If we apply the same logic to activation over time, we can assess the activation reliability for a given voxel by comparing the contrast between two conditions (e.g., visual and baseline) to the temporal noise. In reality there are many ways of calculating the tCNR (for a more detailed overview, see Welvaert & Rosseel, 2013). One way of calculating the tCNR is by dividing the amplitude of a signal by the standard deviation of the residual noise, as shown in the following formula:


Question 6: Using the same Excel sheet, calculate the tCNR for Voxel A and Voxel C. Which one has the highest CNR?
Go back to the widget at the start of the tutorial and reexamine the four cases (high signal+low noise, high signal+high noise...), but now take note of the tCNR.
Question 7: You may have noticed that two of these cases have the same correlation coefficient. Brifely (1-2 sentences) explain how it is possible for two sets of signal and noise values to have the same tCNR.
To summarize…
SNR
Gives information about the spatial quality of a single image
Raw spatial signal relative to background noise
tSNR
Gives information about the temporal quality of a time course
Raw temporal signal relative to temporal noise
Does not give information about activation signal strength
CNR
Gives information about our ability to detect differences between spatial signals (e.g., grey and white matter)
Size of difference between two tissues relative to background noise
tCNR
Gives information about our ability to detect differences in activation between experimental conditions (e.g., visual and baseline)
Difference in activation between two conditions relative to temporal noise
Can be uses as an indicator of signal strength
Calculating tSNR Map (might need plugin? VTC inspector)
Figure 5-3